Gerrymandering in a nutshell
May. 20th, 2009 12:39 pmThis came up in conversation recently and it bothered me how hard it was to explain to some people. I decided to find a good illustration to hopefully make this more clear.
Consider a county containing a city, composed of "Magenta" voters, surrounded by rural area, composed of "Green" voters. The county has 64 total voters (or 640000, if you prefer), 24 of them "Magenta" and 38 of them "Green". The county gets to elect 4 candidates (representatives, judges, school board members, whatever). You would, ideally, expect to see 1-2 Magenta candidates and 2-3 Green candidates get elected (24:38 is between 1:3 and 2:2).
Now, consider what happens when the people drawing the district lines on the map belong to one party or the other...

You can end up with the "fair" results of 1:3 or 2:2 in various ways, but much less fairly you can also produce results of 0:4 (no representatives for the Magenta party) or even 3:1 (a massive representative majority for the minority Magenta party).
If you want to further explore this phenomenon, I suggest you check out The Redistricting Game, which explores gerrymandering in the format of a flash "puzzle" game.
Your thoughts on this illustration, or the socially-ignored issue of gerrymandering, are welcome.
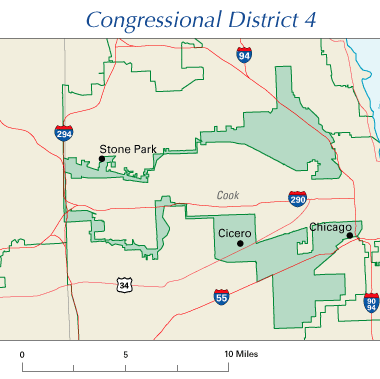
PS: If you think the examples above are unrealistic, check out this (thankfully illegally non-compact, in most states) real "shove all the Hispanics into one district" map from Illinois' District 4 in 2004...
Consider a county containing a city, composed of "Magenta" voters, surrounded by rural area, composed of "Green" voters. The county has 64 total voters (or 640000, if you prefer), 24 of them "Magenta" and 38 of them "Green". The county gets to elect 4 candidates (representatives, judges, school board members, whatever). You would, ideally, expect to see 1-2 Magenta candidates and 2-3 Green candidates get elected (24:38 is between 1:3 and 2:2).
Now, consider what happens when the people drawing the district lines on the map belong to one party or the other...
You can end up with the "fair" results of 1:3 or 2:2 in various ways, but much less fairly you can also produce results of 0:4 (no representatives for the Magenta party) or even 3:1 (a massive representative majority for the minority Magenta party).
If you want to further explore this phenomenon, I suggest you check out The Redistricting Game, which explores gerrymandering in the format of a flash "puzzle" game.
Your thoughts on this illustration, or the socially-ignored issue of gerrymandering, are welcome.
PS: If you think the examples above are unrealistic, check out this (thankfully illegally non-compact, in most states) real "shove all the Hispanics into one district" map from Illinois' District 4 in 2004...